Debugging Python with Visual Studio Code
I am curious kid on the web, trying to learn more about life and other things. I enjoy building things and my medium of expression is mostly code. I have been dabbling with OpenEdx recently. I love to talk about distributed system, I have taken up learning Rust recently and been writing Python, Golang and JavaScript for a while.
I have started using Visual Studio Code, and to be honest, I feel it’s one of the best IDEs in the market. I’m still a Vimmer; given a chance I still use VIM for small edits or carrying out nifty text transformations. After Vim, the next tool that has really impressed me is VSC; the innovations the team are doing, the utility that it provides is almost a super power.
This post is regarding one of the utilities that I have been using very recently. This is a skill that I have been trying to harness for a long time. For every person who writes code there comes a time where they need to figure out what is going wrong; there’s a need to debug the code.
The most prominent and well used debugging tools are print statements. To be really honest, it doesn’t feel (to me) quite right to use print statements to debug my code, but that’s the most handy way to figure out the flow and inspect each variable. I’ve tried a lot of debuggers and it alway feels like extra effort to actually take a step up and use them. This could be one of the reasons I might have not used them very intensively. (Although I have used [pudb](https://farhaanbukhsh.wordpress.com/2016/06/30/investigating-python/) extensively.)
But, with VS Code, the way debugger is integrated in really well. It feels very natural to use it. Recently when I was working on few scripts and was trying to debug them, I went on exploring a little more with the python debugger in VS Code.
So I have this script and I want to run the debugger or it. You hit ctrl + alt + p, this opens the the command drop down, just type debug and you will see the option, Debug and start debugging.
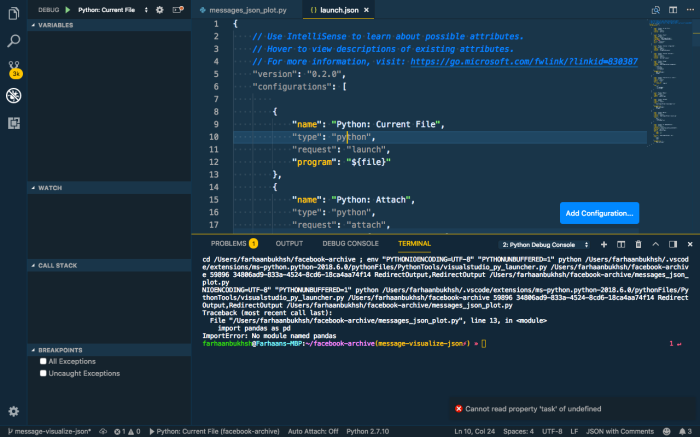
This actually creates a launch.json file in your project. You can put all your configuration in here. We’ll edit the config file as we go; since it is not a Django or Flask project we will use the current file configuration. That looks like this:
{
"name":"Python: Current File",
"type":"python",
"request":"launch",
"program":"${file}"
}
You can set the pythonPath here if you are using a virtual environment, name sets the name of the configuration, type is the type of file, that is being debugged it, and request can be used to debug it in different ways. Let’s make our configs more customised,
{
"name":"Facebook Achieve Debug",
"type":"python",
"request":"launch",
"program": "${flle}"
}
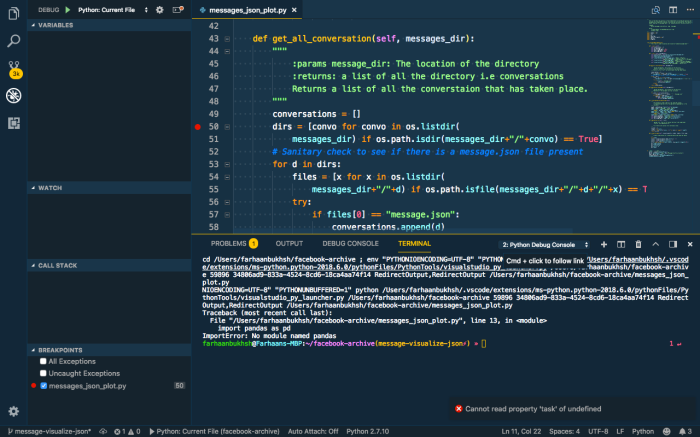
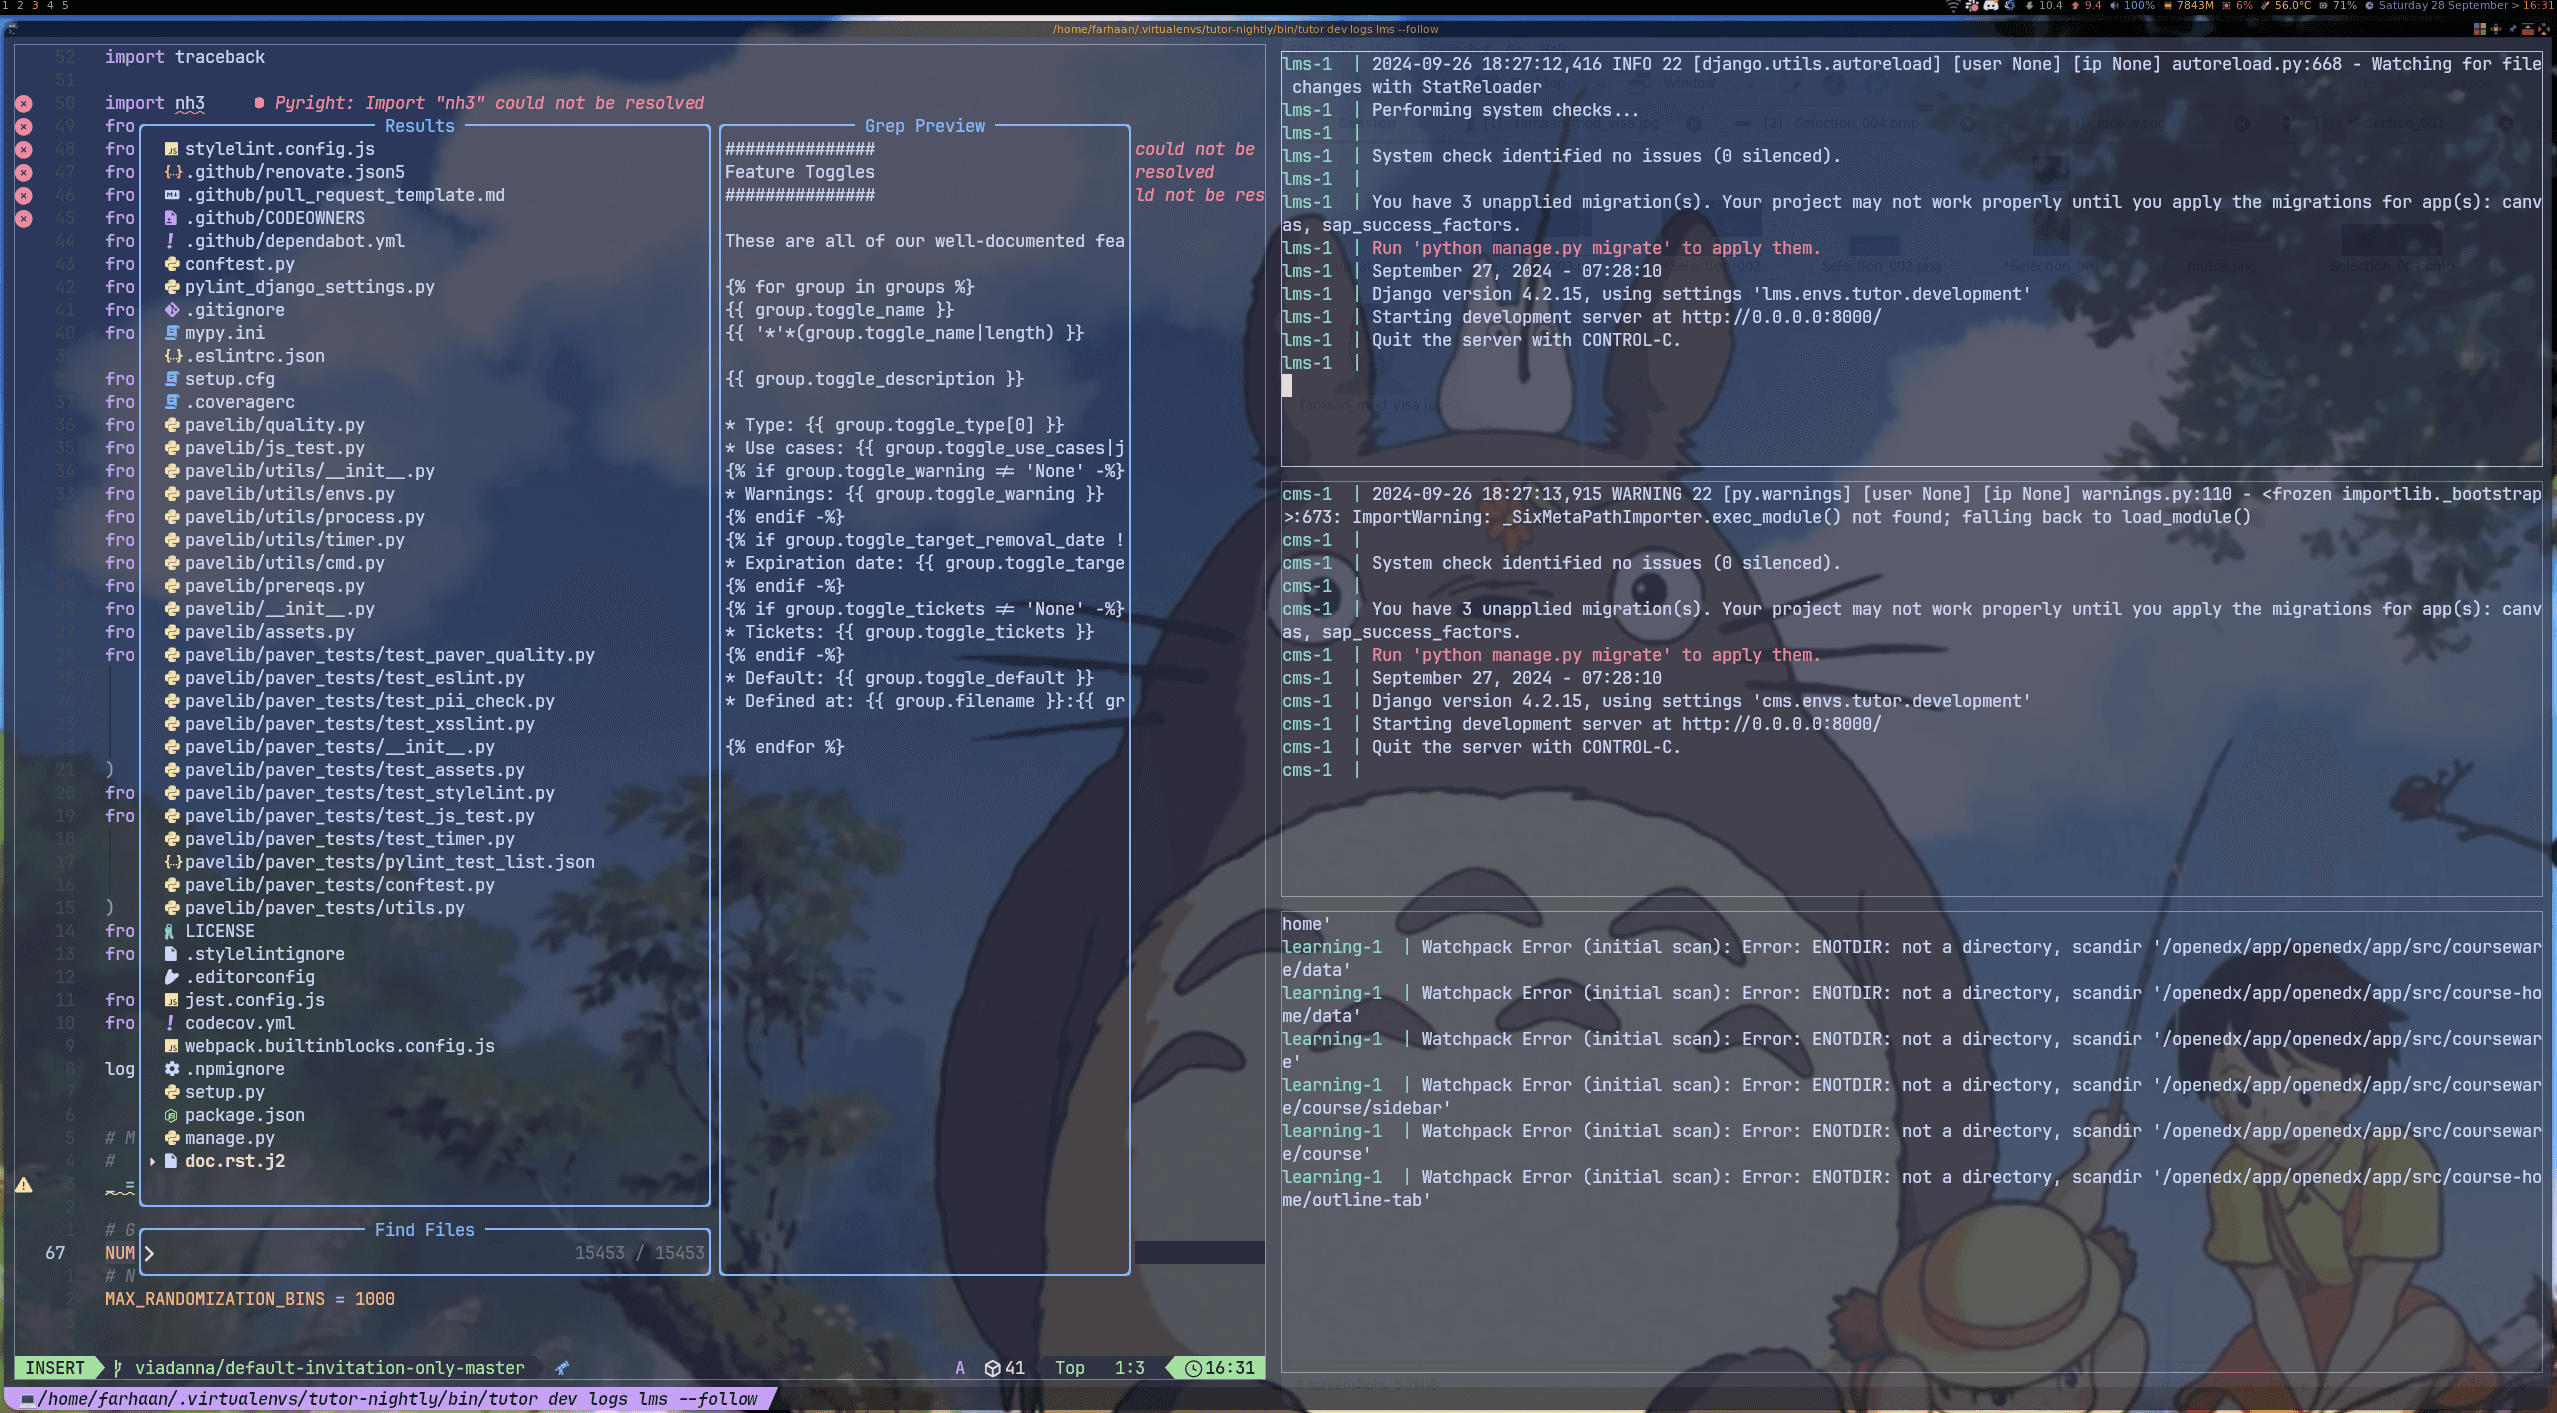
If you observe there’s a red dot at line 50. That is called the breakpoint and that is where the program will stop and you will be able to observe variables and see the flow of the program.
Let’s see what the screen looks like when you do that,
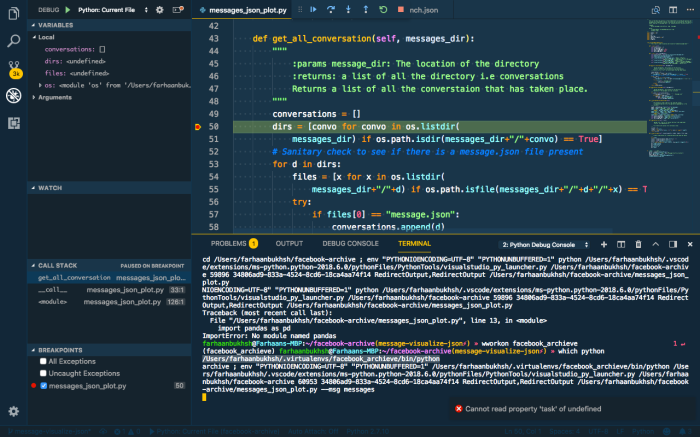
This is the editor in full flow, you could see the stack that is being followed, you can also go and inspect each variable.
With the debug console (lower right pane) you can even run some code that you want to run or to inspect the same. Now, let us look at the final config and see what is going on.
{
"name":"Python: Current File",
"type":"python",
"request":"launch",
"program":"${file}",
"pythonPath":"/Users/farhaanbukhsh/.virtualenvs/facebook_archieve/bin/python",
"args":[
"--msg",

"messages"
]
}
If you observe I have the pythonPath set to my virtualenv and I have one more argument which is args which is the command-line argument that has to be passed to the script.
I still use print statement sometimes but I have made it a sure point to start using the debugger as early as possible because, believe it or not, this definitely helps a lot and saves time.