Investigating Python
I am curious kid on the web, trying to learn more about life and other things. I enjoy building things and my medium of expression is mostly code. I have been dabbling with OpenEdx recently. I love to talk about distributed system, I have taken up learning Rust recently and been writing Python, Golang and JavaScript for a while.
I have been trying to implement private projects on Pagure, while doing that I was struggling with certain design of a function and while doing that I constantly have to switch between shell, editor and at times browser.
I am not saying it is a bad thing or a good thing but this lead me to find a debugger I thought that might ease my task of finding what is going wrong and where and it actually helped.
I used a python debugger called pudb. This looks like Turbo C but its a lot more useful. This can be used in one of the two ways:
- You can directly debug a script pudb .py
- You may need to call certain function when you are working with big projects in that case you can just put import pudb; pu.db
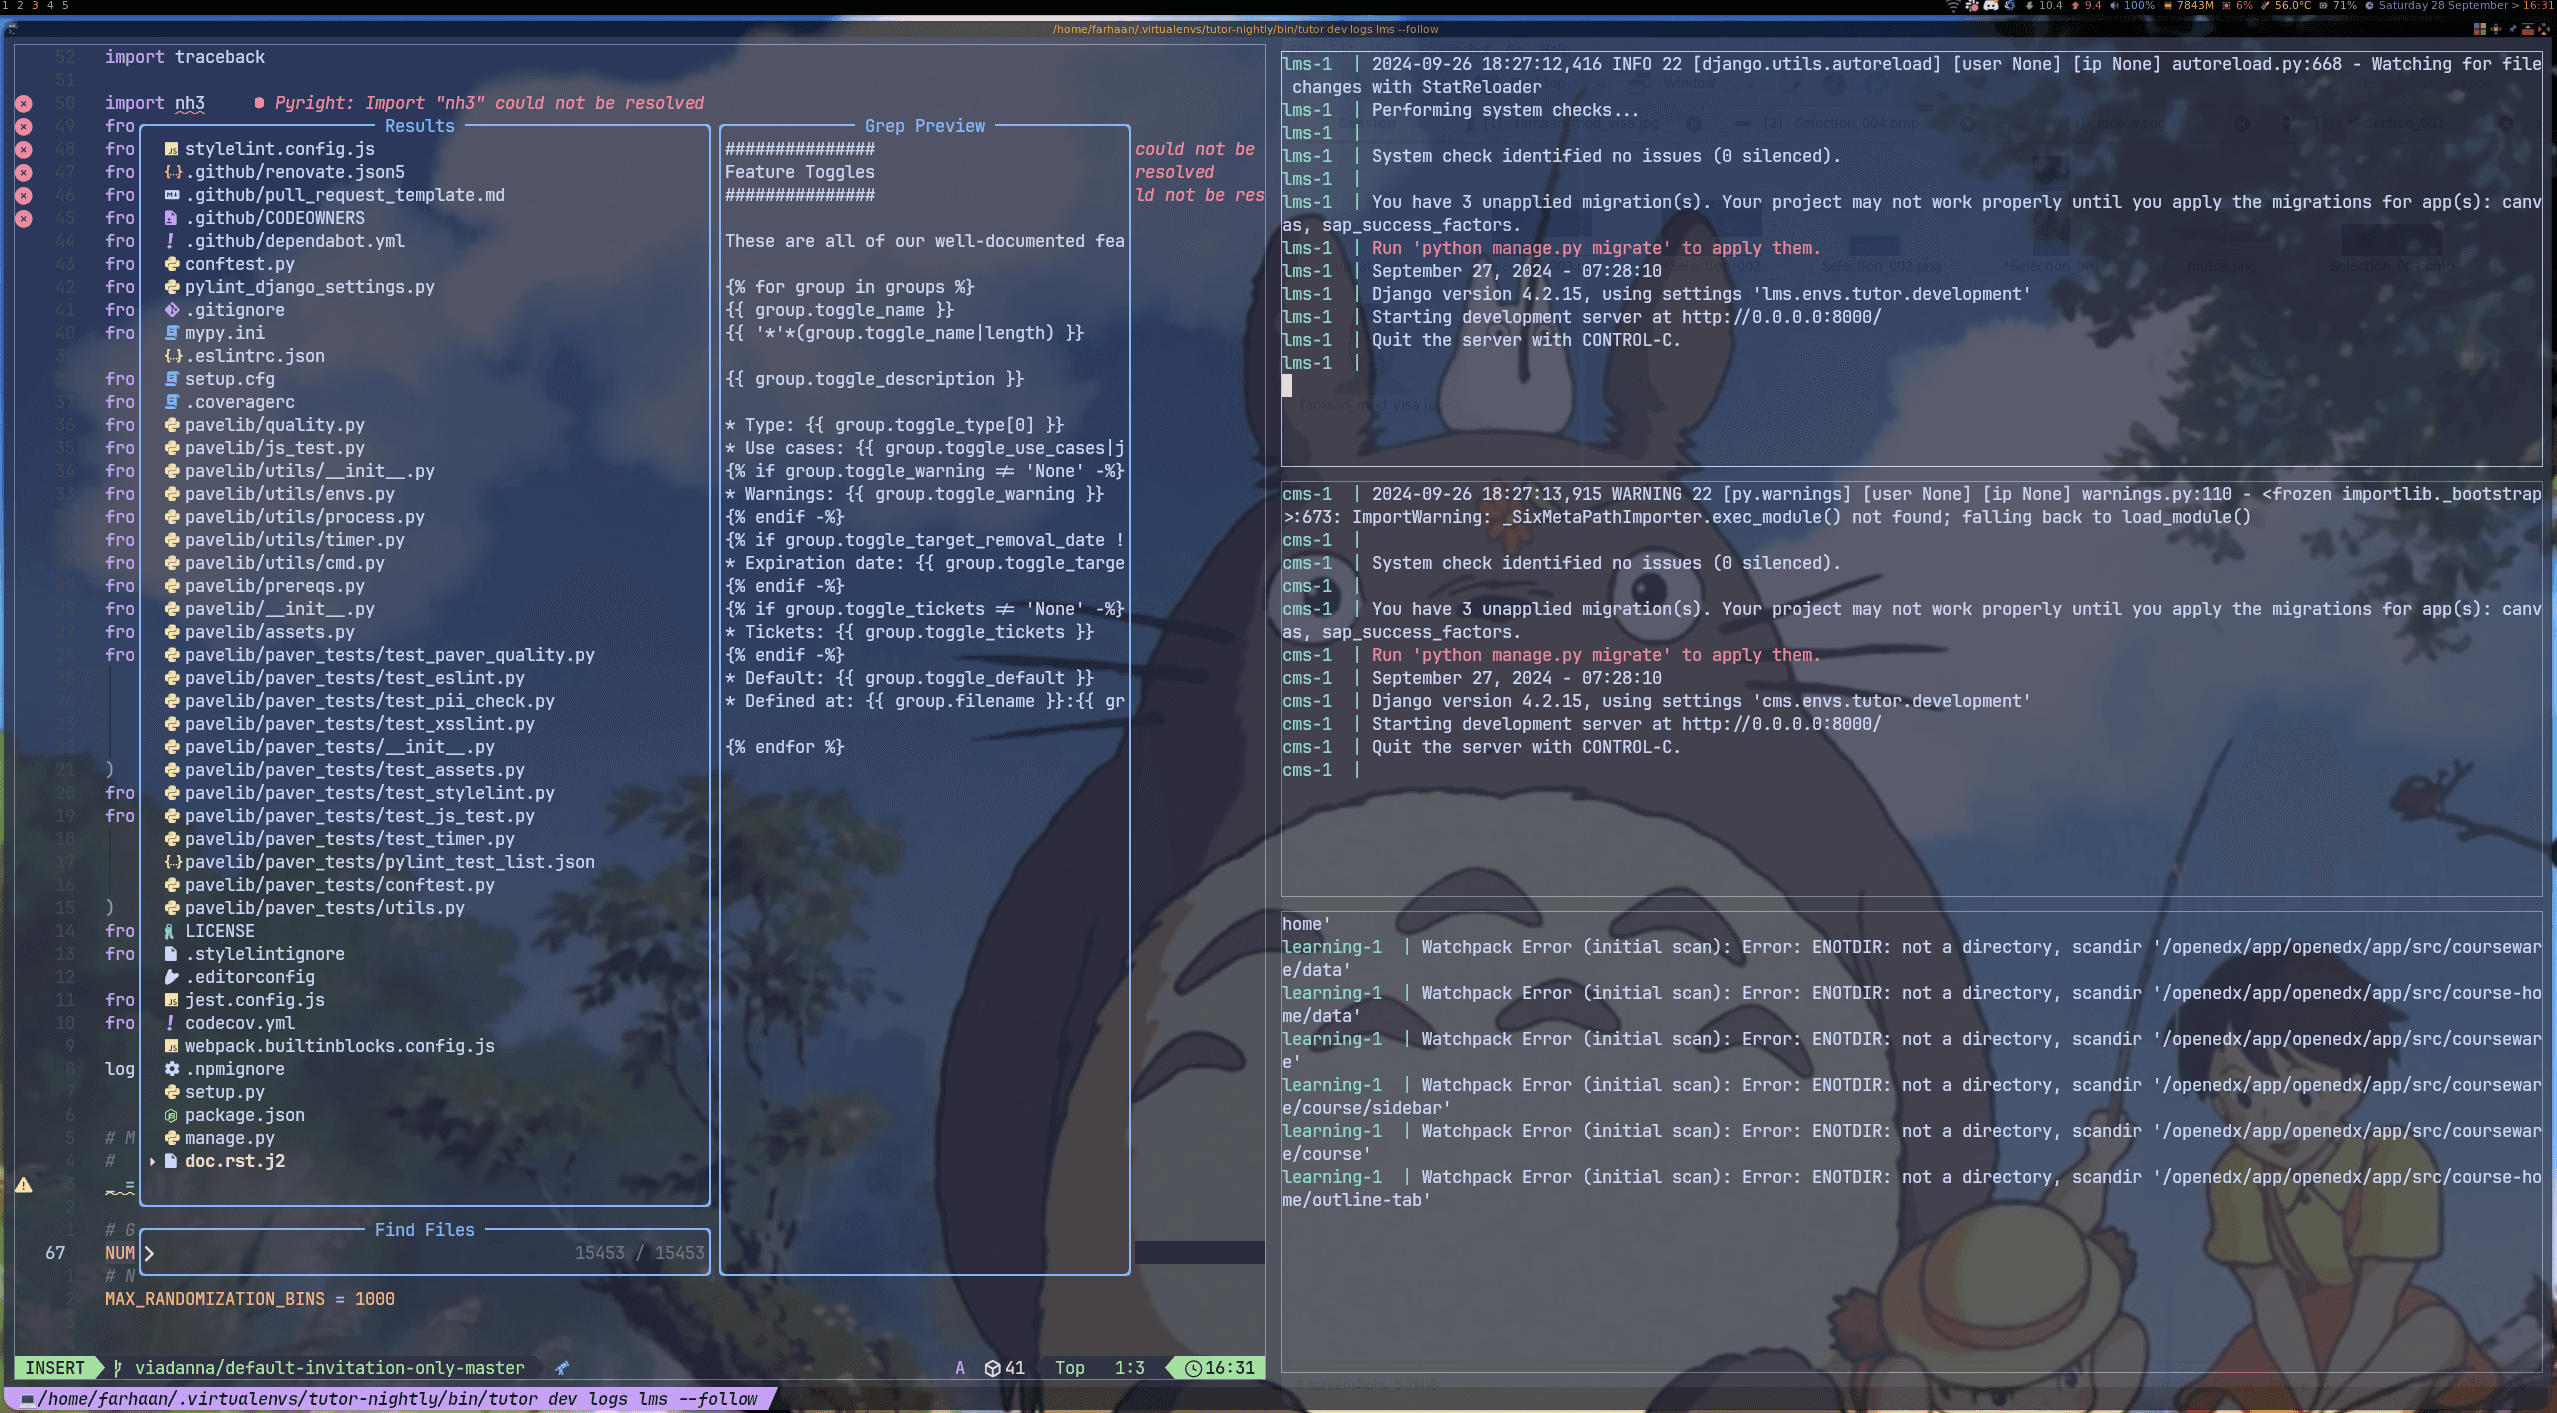
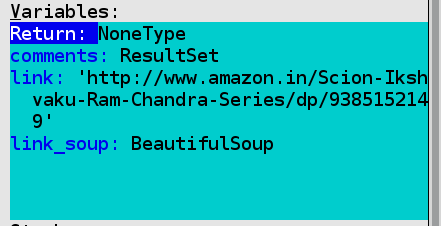
The most beautiful thing is, it just pops an IDE out of no where, it gives a deep insight about what code i s doing, how it is doing , what stack it is maintaining and what are the various values of variables.
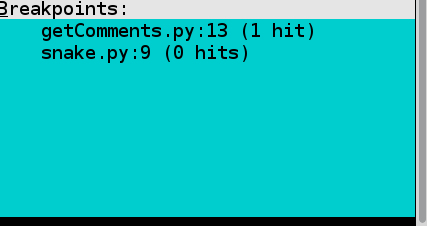
You can always set breakpoints so that you can investigate about the code, you actually play a detective. This is actually an important point in developing in an opensource project since there are a lot of functions doing a lot of Hocus Pocus.
This is one of those tools that might even help you to understand the code base better , it really helped me to design the code better.
This is the script that I am trying to debug, the screen looks like this and ‘n’ can let you to go to the next line which can be investigated using the stacks shown.
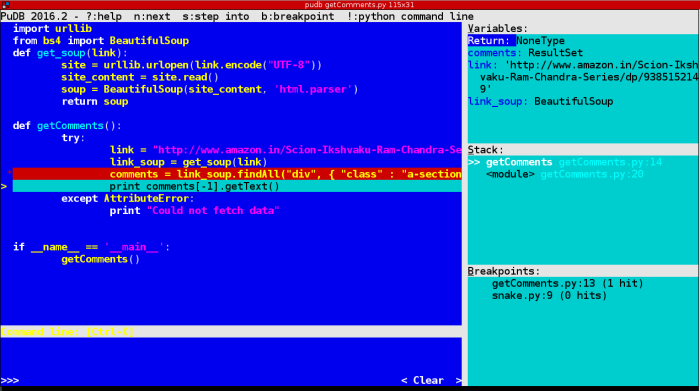
These are the few windows that you can navigate to and see what is going on.
Not only this but you can jump between different modules and you can set breakpoints.
This might help you get some cool insight about the project.
Happy Hacking !